
Data Aggregation#
Although Gravwell queries are fast, some questions, like “how much data did we ingest into each tag over the last year”, can take a while to answer due to the massive quantities of data involved. If you have to pull 150 TB of entries off the disk in order to tally up sizes per tag, it may take a while!
Our recommended solution? Ingest some more stuff; specifically, ingest periodic statistics about your data. We call these “aggregates”, or just “aggs”. Gravwell includes a pre-built aggregate flow which does basic aggregation with zero configuration required on the user’s part, and you can build your own flows to generate custom aggs. This page shows how to deploy the pre-built aggregate flow, how to query aggs, and gives some hints on building your own agg flows.
Note
By convention, aggregates are ingested into tags beginning with _aggs, e.g. _aggs_tags, _aggs_userstats, etc. The default gravwell.conf configuration includes a separate well specifically for aggregates for the sake of performance and retention.
The pre-built agg flow#
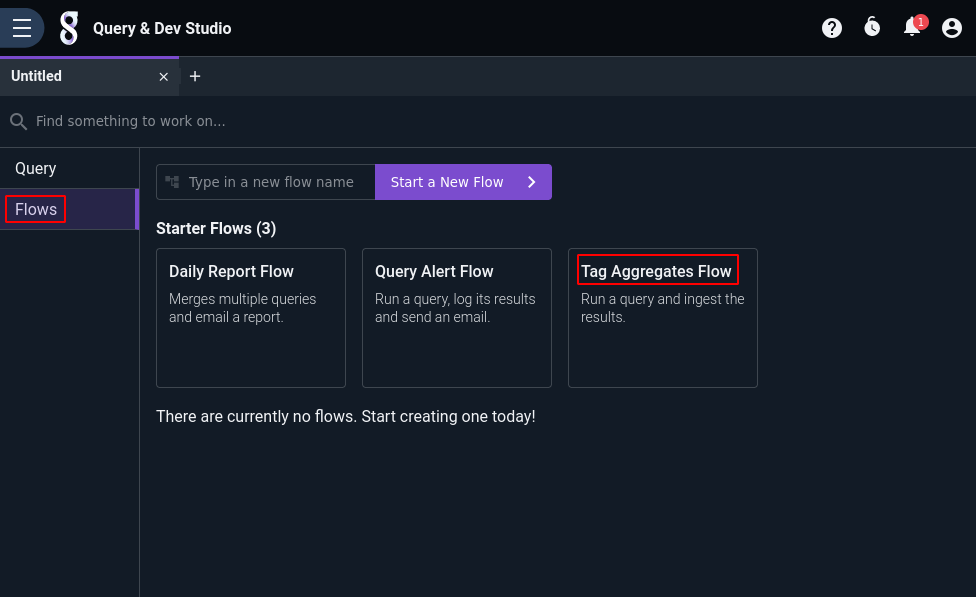
To instantiate & begin using the pre-built aggregates flow, open the Query Studio, select the Flows tab, and click on “Tag Aggregates Flow” under the “Starter Flows” section, as seen below:
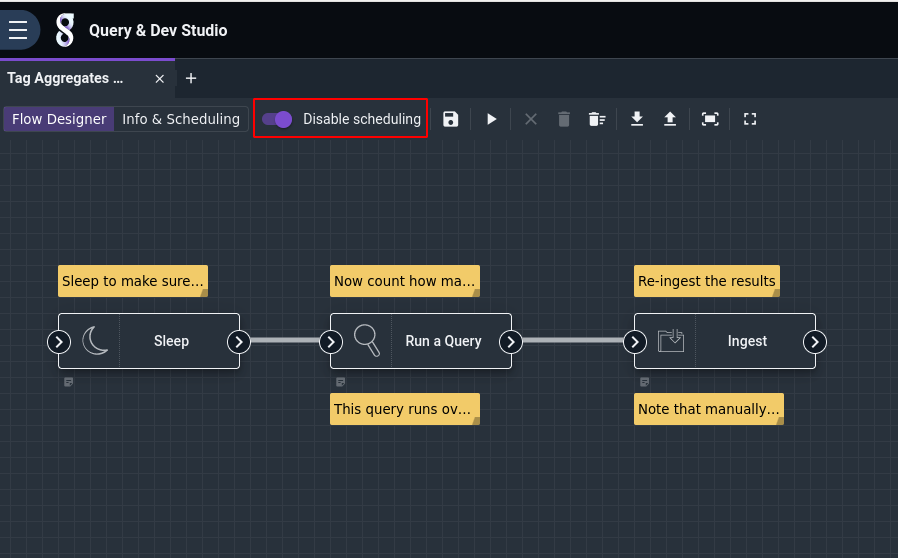
This will instantiate that pre-built flow into a “real” flow owned by you and open it in the flow editor. The only step remaining is to enable scheduled execution of the flow by toggling the “Disable scheduling” option:
With scheduling enabled, the flow will begin running automatically. By default, it runs every hour; you can generate finer-grained aggregates by clicking the “Info & Scheduling” tab in the flow editor, then modifying the cron schedule string. In the example below, the schedule has been changed from the default (0 * * * *, meaning “hourly”) to run every 5 minutes (*/5 * * * *):

Now that the flow is running and generating aggs, it is instructive to take a look at what it actually does. The flow is composed of 3 nodes: Sleep, Run Query, and Ingest.
The Sleep node makes execution of the flow pause for 30 seconds. This allows any “late” entries to get fully ingested so they can be properly counted.
The Run Query node runs the following Gravwell query over the interval of the flow–the last hour, the last 5 minutes, etc. Critically, it runs the search up until the time the flow was scheduled to begin execution, not the current time, so statistics will be properly bounded:
tag=* length
| stats sum(length) as bytes count as entries by TAG
| sort by bytes desc
| table TAG entries bytes
The query is pretty simple: it pulls all entries from all tags and computes their length. It then sums up the lengths and counts the number of entries, maintaining separate totals for each tag. It then sorts those results to place the biggest sum first, and outputs the results in a table.
Finally, the Ingest node is configured to ingest the results of that search into the _aggs_tags tag. Each row in the table (consisting of a tag name, an entry count, and a byte total) becomes a separate entry.
Querying aggregates#
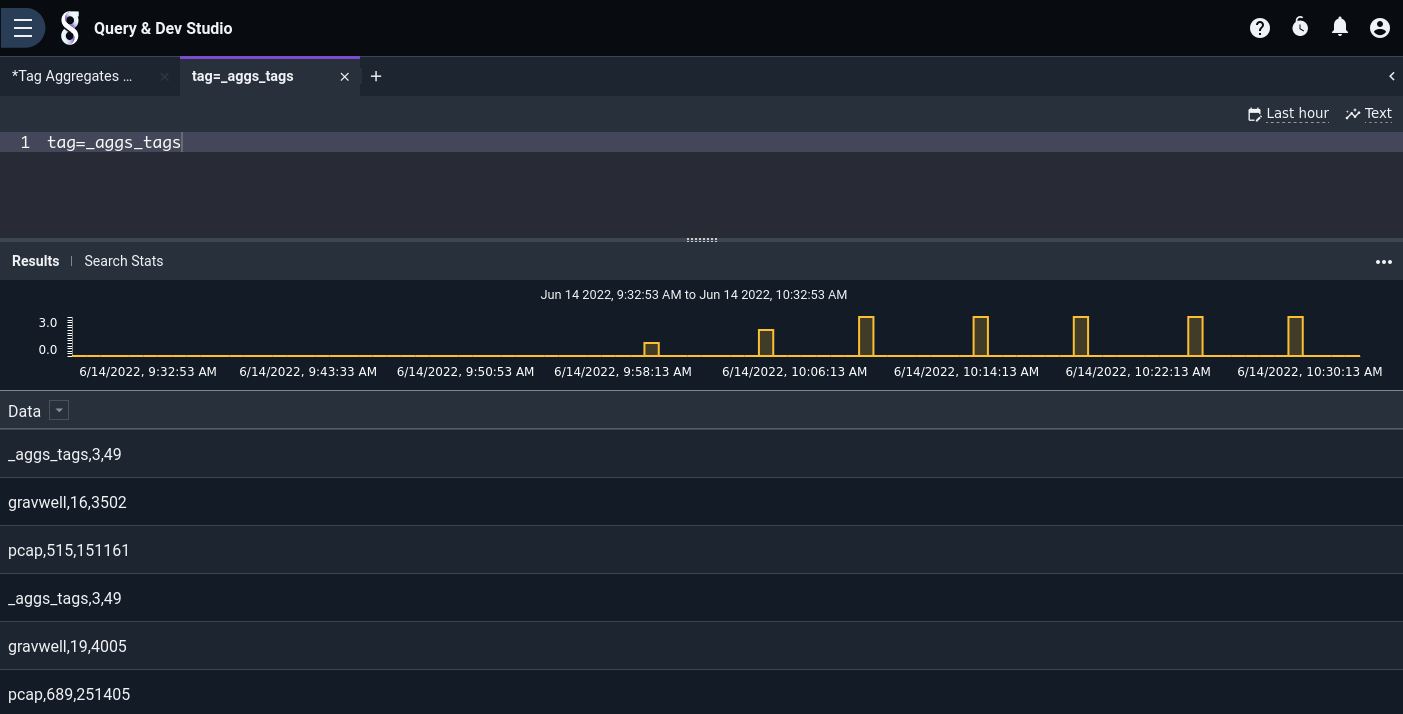
The basic per-tag aggregates end up in the Gravwell tag named _aggs_tags. The raw entries are in CSV format:
We can use the csv module to break out the individual fields:
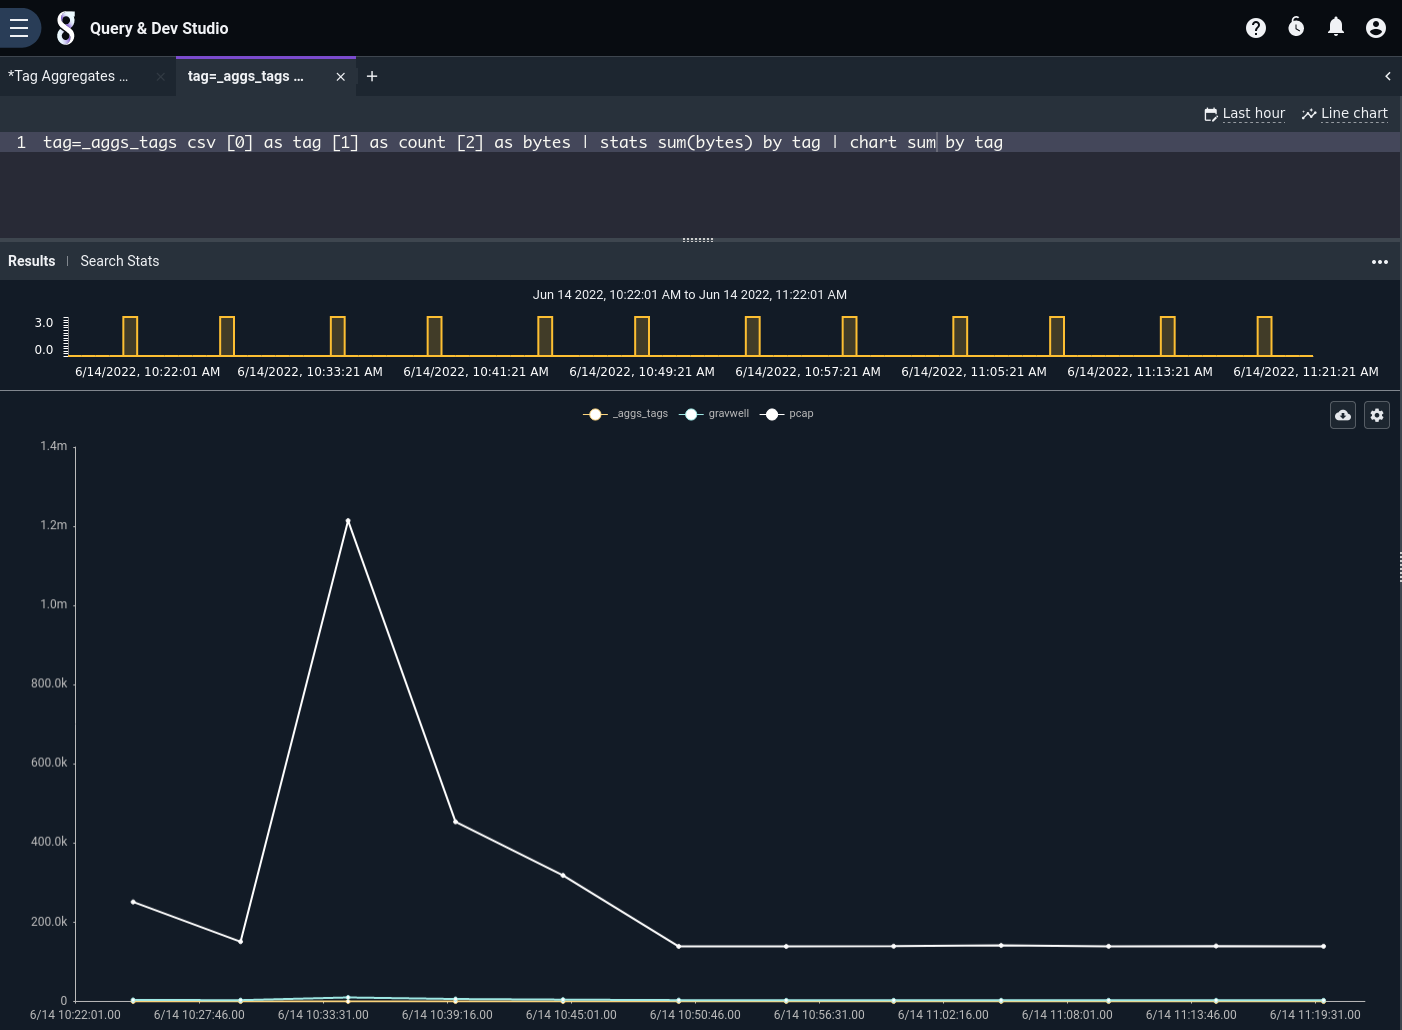
tag=_aggs_tags csv [0] as tag [1] as count [2] as bytes | table
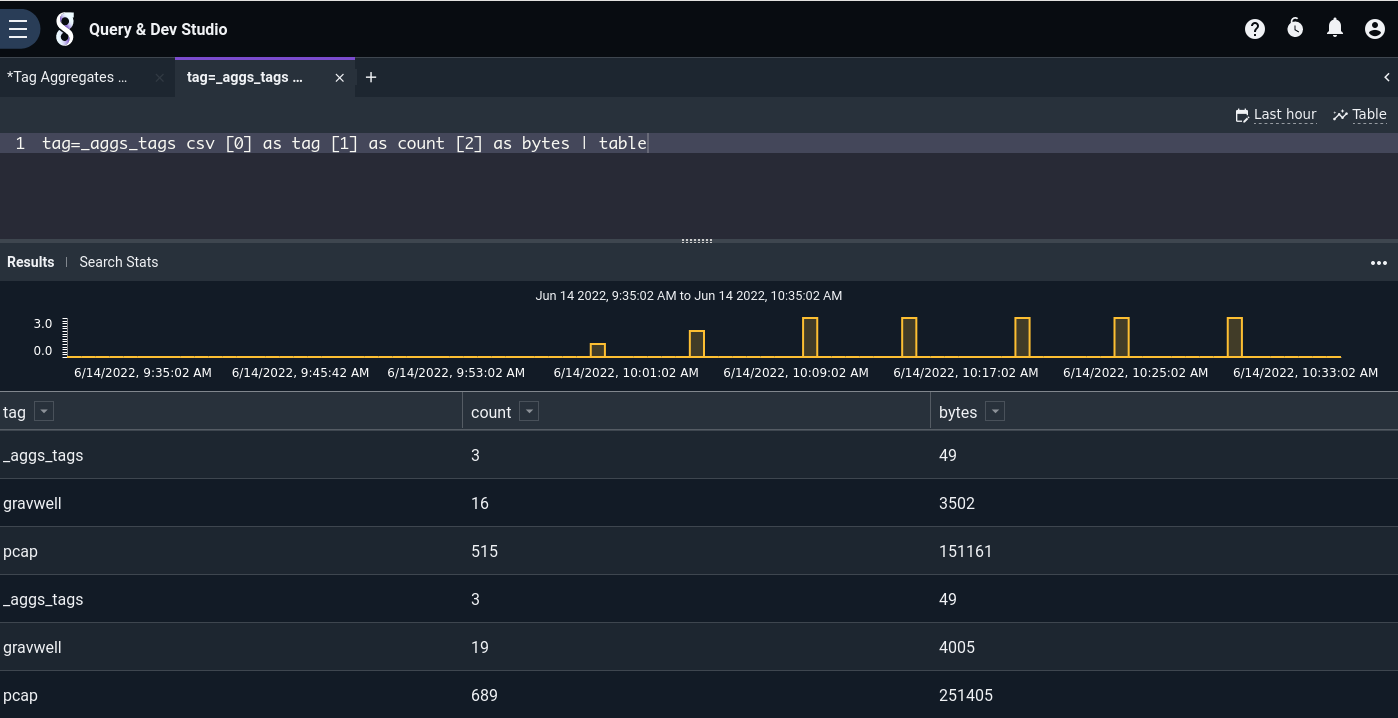
Each row in the table represents totals for that tag over a 5-minute period. By invoking the stats module, we can generate sums suitable for use in a chart:
tag=_aggs_tags csv [0] as tag [1] as count [2] as bytes | stats sum(bytes) by tag | chart sum by tag
Note
The aggregated entries must pass through the stats module before being charted. Consider the table of _aggs_tags results shown earlier; it contains 5-minute counts for each different tag. Each of these counts must be summed (using the stats module) in order to get valid results.
Building your own aggs#
The same pattern used in the pre-built aggregates flow (run a query, ingest the results) can be applied to generate summarized statistics for other purposes, too. By building a few well-thought-out aggregate flows and basing dashboards on those rather than on the raw data, you can significantly improve performance for commonly-used queries.
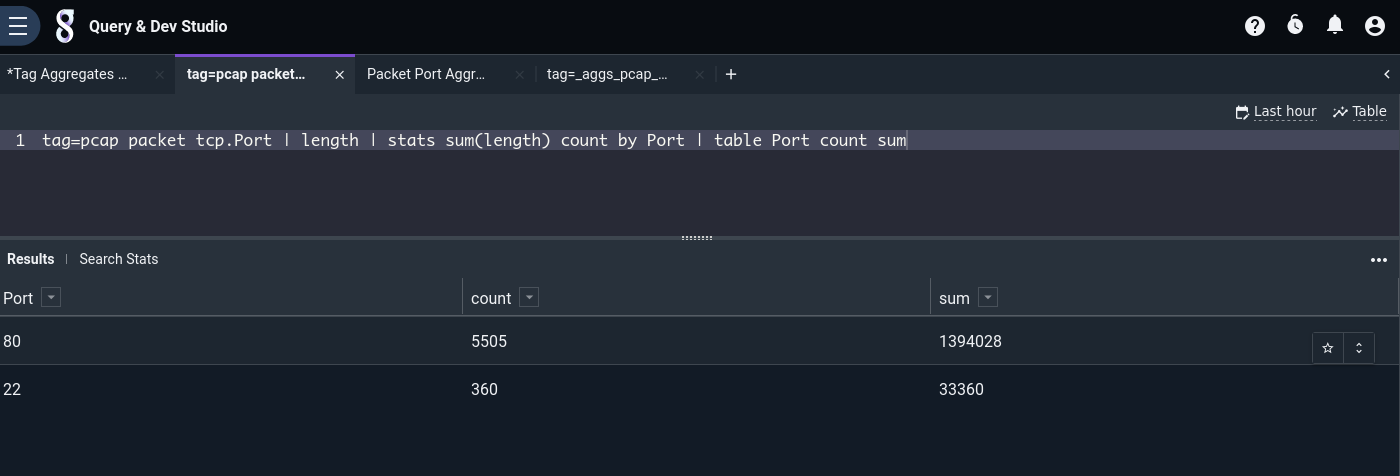
For instance, suppose we frequently want to check which TCP ports are seeing the most traffic. We can compute the number of packets and number of bytes sent using this query:
tag=pcap packet tcp.Port
| length
| stats sum(length) count by Port
| table Port count sum
However, if we’re doing full packet capture, there may be huge quantities of packets involved, and the query could take quite a while. If we wish to include this information in a dashboard and refer to it often, it makes sense to craft a custom agg flow. We can actually base it on the same pre-built flow as before (click “Tag Aggregates Flow” under the “Sample Flows” section of the Query Studio), we just need to make a few tweaks:
Rename the flow to something like “Packet Port Aggregates”.
Change the Run Query node’s query to match the one above instead of the default.
Change the Ingest node so it ingests into a different tag, e.g.
_aggs_pcap_ports.
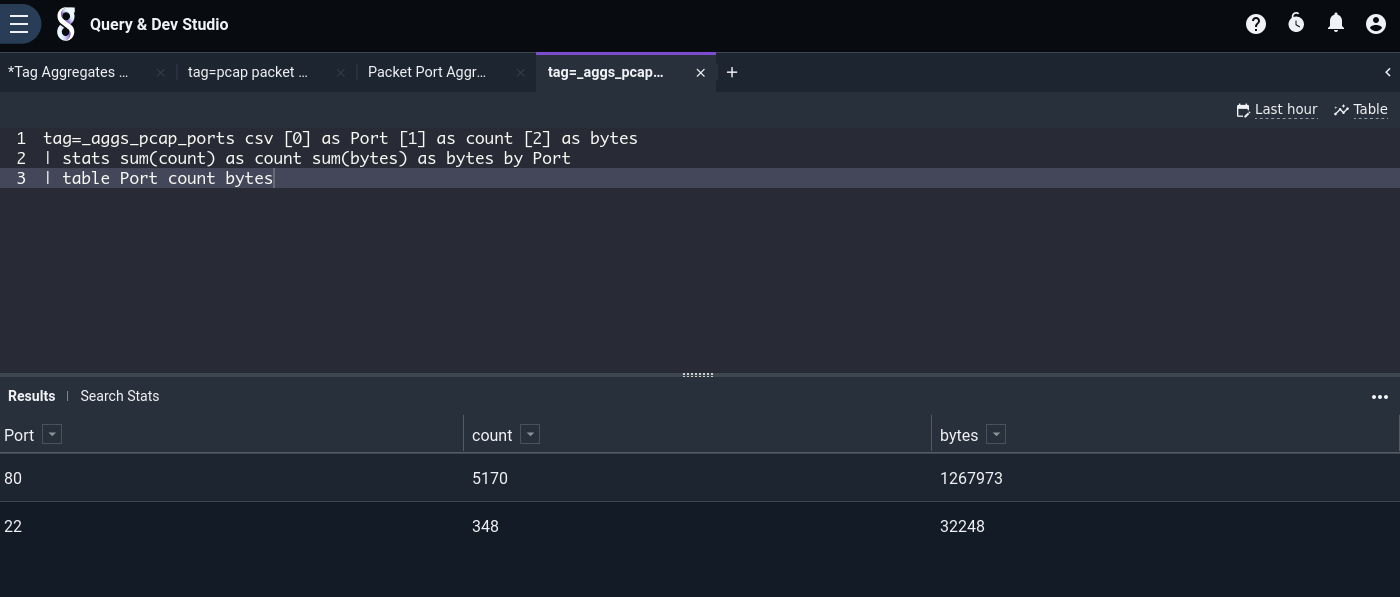
Once the flow is running, we can again use the csv module to generate a table like the one seen above:
tag=_aggs_pcap_ports csv [0] as Port [1] as count [2] as bytes
| stats sum(count) as count sum(bytes) as bytes by Port
| table Port count bytes
Agg caveats#
Keep in mind that, since aggregates are built up by periodically executing a flow which runs Gravwell queries and re-ingests the results, there are several cluster problems which could cause the flow’s execution to fail, meaning aggregates are not generated for a given time period:
Search agent service is down / cannot communicate with webserver.
Webserver is down.
Indexer(s) are down / inaccessible to the webserver.
Also note that if multiple users instantiate the same agg flow, duplicate aggregate entries will be ingested! Queries which use duplicate aggs will have incorrect results. For this reason, in a multi-user Gravwell installation we recommend restricting ingest permissions to admin users only (see Webserver-Ingest-Groups in the configuration page) and coordinating with other admin users to ensure duplicate flows are not in use.