
Splunk Query Node#
This node executes a Splunk query. It outputs a structure into the payload (named splunkResults by default) which contains information about the search and allows other nodes to access the results.
Configuration#
Splunk Server Address, required: the Splunk server.Splunk Auth Token, required: a Splunk authentication tokenQuery, required: the Splunk query to run (see note below).Result Count, required: the number of results to fetch.Duration, required: the timeframe over which to run. You can manually set a duration, or by selecting the variableflow.Intervalthe query will run over the scheduled timespan of the flow, e.g. if the flow is scheduled to run@daily, the query will run over the last 24 hours.Output Name: the name to use for results in the payload, default “splunkResults”.
Splunk Query Caveats#
In the Splunk web UI, one might run the following query to see a table of failed logins:
index=_audit action="login attempt" "info=failed" | stats count by user | table user count
However, that exact query will not work in the Splunk Query node, because the Splunk UI adds an implicit search to the start of the query. To run the same query in a Gravwell flow, you must add the search string explicitly:
search index=_audit action="login attempt" "info=failed" | stats count by user | table user count
Output#
The node inserts an object (named splunkResults by default) into the payload containing information about the search. The component fields are:
Query: the query which was executed.Start: the beginning of the timespan over which the search executed.End: the end of the timespan over which the search executed.Duration: the span of time between Start and End.Count: the number of entries returned by the query.Results: the results of the query (see below).
The Results field is an array of objects, each representing one line of results from the Splunk query.
Note that the top-level splunkResults object can be passed directly to the Ingest node; the results will be JSON-encoded and ingested.
Example#
This example queries a Splunk server for a table of failed logins, formats the results, and mails the results out:
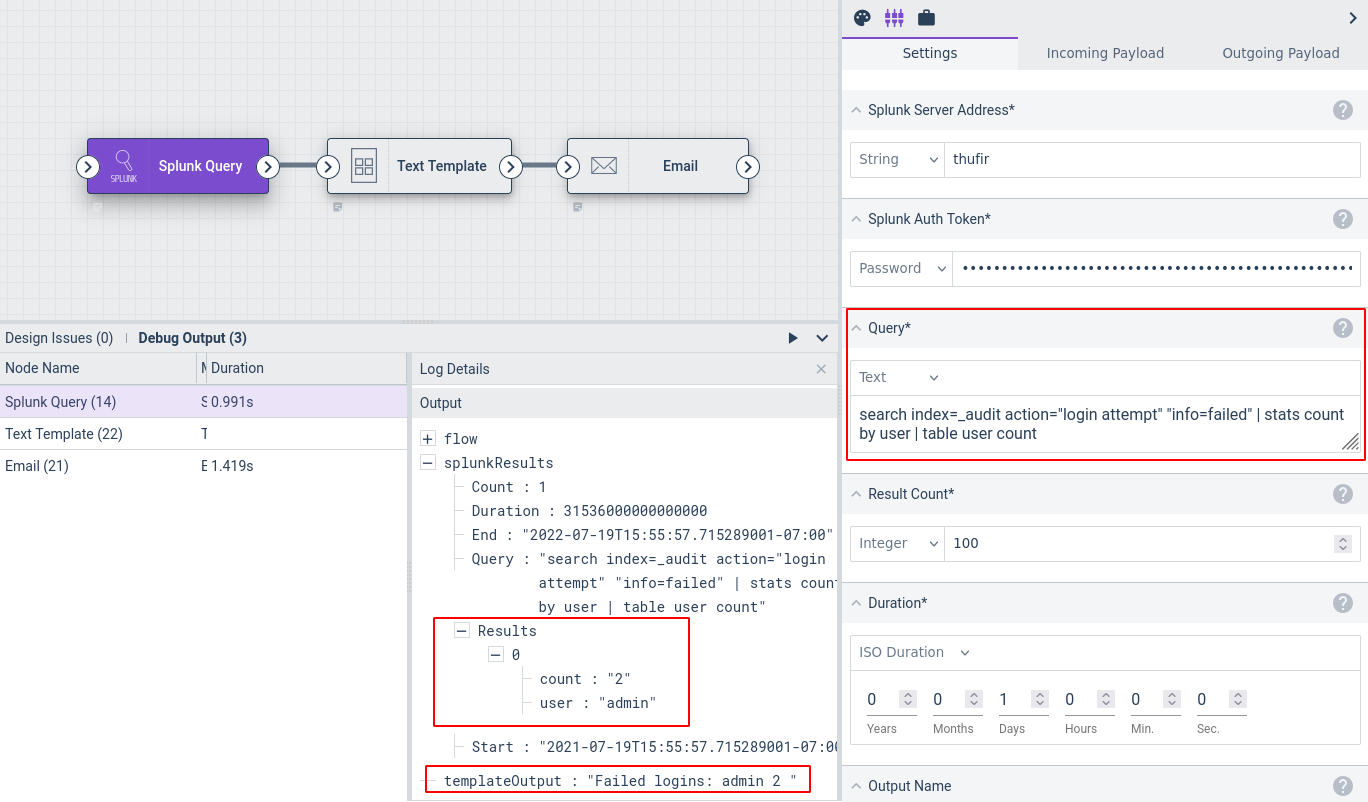
The Splunk Query node is configured to run search index=_audit action="login attempt" "info=failed" | stats count by user | table user count, with the timeframe set to the last day.
The Text Template node does a little simple formatting of the results by iterating over splunkResults.Results and printing the “user” and “count” fields:
Failed logins:
{{range .splunkResults.Results}}{{.user}} {{.count}}
{{end}}
The Email node is configured to send the output of the Text Template node as the body of an email to the administrator.