Network Capture Ingester#
A primary strength of Gravwell is the ability to ingest binary data. The network ingester allows you to capture full packets from the network for later analysis; this provides much better flexibility than simply storing netflow or other condensed traffic information.
Installation#
To install the Debian package, make sure the Gravwell Debian repository is configured as described in the quickstart. Then run the following command as root:
apt update && apt install gravwell-network-capture
To install the Redhat package, make sure the Gravwell Redhat repository is configured as described in the quickstart. Then run the following command as root:
yum install gravwell-network-capture
To install via the standalone shell installer, download the installer from the downloads page, then run the following command as root, replacing X.X.X with the appropriate version:
bash gravwell_network_capture_installer_X.X.X.sh
You may be prompted for additional configuration during the installation.
The Docker image is available on Dockerhub.
Basic Configuration#
The Network Capture ingester uses the unified global configuration block described in the ingester section. Like most other Gravwell ingesters, the Network Capture ingester supports multiple upstream indexers, TLS, cleartext, and named pipe connections, a local cache, and local logging.
The configuration file is at /opt/gravwell/etc/network_capture.conf. The ingester will also read configuration snippets from its configuration overlay directory (/opt/gravwell/etc/network_capture.conf.d).
Sniffer Examples#
[Sniffer "spy1"]
	Interface="p1p1" #sniffing from interface p1p1
	Tag-Name="pcap"  #assigning tag  of pcap
	Snap-Len=0xffff  #maximum capture size
	BPF-Filter="not port 4023" #do not sniff any traffic on our backend connection
	Promisc=true

[Sniffer "spy2"]
	Interface="p5p2"
	Source-Override=10.0.0.1
Installation#
If you’re using the Gravwell Debian repository, installation is just a single apt command:
apt-get install libpcap0.8 gravwell-network-capture
Otherwise, download the installer from the Downloads page. To install the network ingester, simply run the installer as root (the file name may differ slightly):
root@gravserver ~ # bash gravwell_network_capture_installer.sh
Note
You must have libpcap installed for the ingester to work.
It is highly advised to co-locate the network ingester with an indexer when possible and use a pipe-conn link to send data, rather than a clear-conn or tls-conn link. If the network ingester is capturing from the same link it is using to push entries, a feedback loop can be created which will rapidly saturate the link (e.g. capturing from eth0 while also sending entries to the ingester via eth0). You can use the BPF-Filter option to alleviate this.
If the ingester is on a machine with a Gravwell backend already installed, the installer should automatically pick up the correct Ingest-Secrets value and populate the config file with it. Otherwise, it will prompt for the indexer’s IP address and the ingest secret. In any case, review the configuration file in /opt/gravwell/etc/network_capture.conf before running. An example which captures traffic from eth0 might look like this:
[Global]
Ingest-Secret = IngestSecrets
Connection-Timeout = 0
Insecure-Skip-TLS-Verify = false
#Cleartext-Backend-Target=127.1.0.1:4023 #example of adding a cleartext connection
#Encrypted-Backend-Target=127.1.1.1:4023 #example of adding an encrypted connection
Pipe-Backend-Target=/opt/gravwell/comms/pipe #a named pipe connection, this should be used when ingester is on the same machine as a backend
Log-Level=INFO #options are OFF INFO WARN ERROR
Ingest-Cache-Path=/opt/gravwell/cache/network_capture.cache

#basic default logger, all entries will go to the default tag
#no Tag-Name means use the default tag
[Sniffer "spy1"]
	Interface="eth0" #sniffing from interface eth0
	Tag-Name="pcap"  #assigning tag  of pcap
	Snap-Len=0xffff  #maximum capture size
	#BPF-Filter="not port 4023" #do not sniff any traffic on our backend connection
	#Promisc=true
You can configure any number of Sniffer entries in order to capture from different interfaces.
If disk space is a concern, you may wish to change the Snap-Len parameter to capture only packet metadata. A value of 96 is usually sufficient to capture only headers.
Due to the potential for very high bandwidth links it is also advisable to assign the network capture data to its own well; this requires configuration on the indexer to define a separate well for the packet capture tags.
The NetworkCapture ingester also supports native BPF filtering using the BPF-Filter parameter, which adheres to the libpcap syntax. To ignore all traffic on port 22, one could configure a sniffer like this:
[Sniffer "no-ssh"]
	Interface="eth0"
	Tag-Name="pcap"
	Snap-Len=0xffff
	BPF-Filter="not port 22"
If the ingester is on a different system than the indexer, meaning entries must traverse the network to be ingested, you should set BPF-Filter to “not port 4023” (if using cleartext) or “not port 4024” (if using TLS).
Example Network Searches#
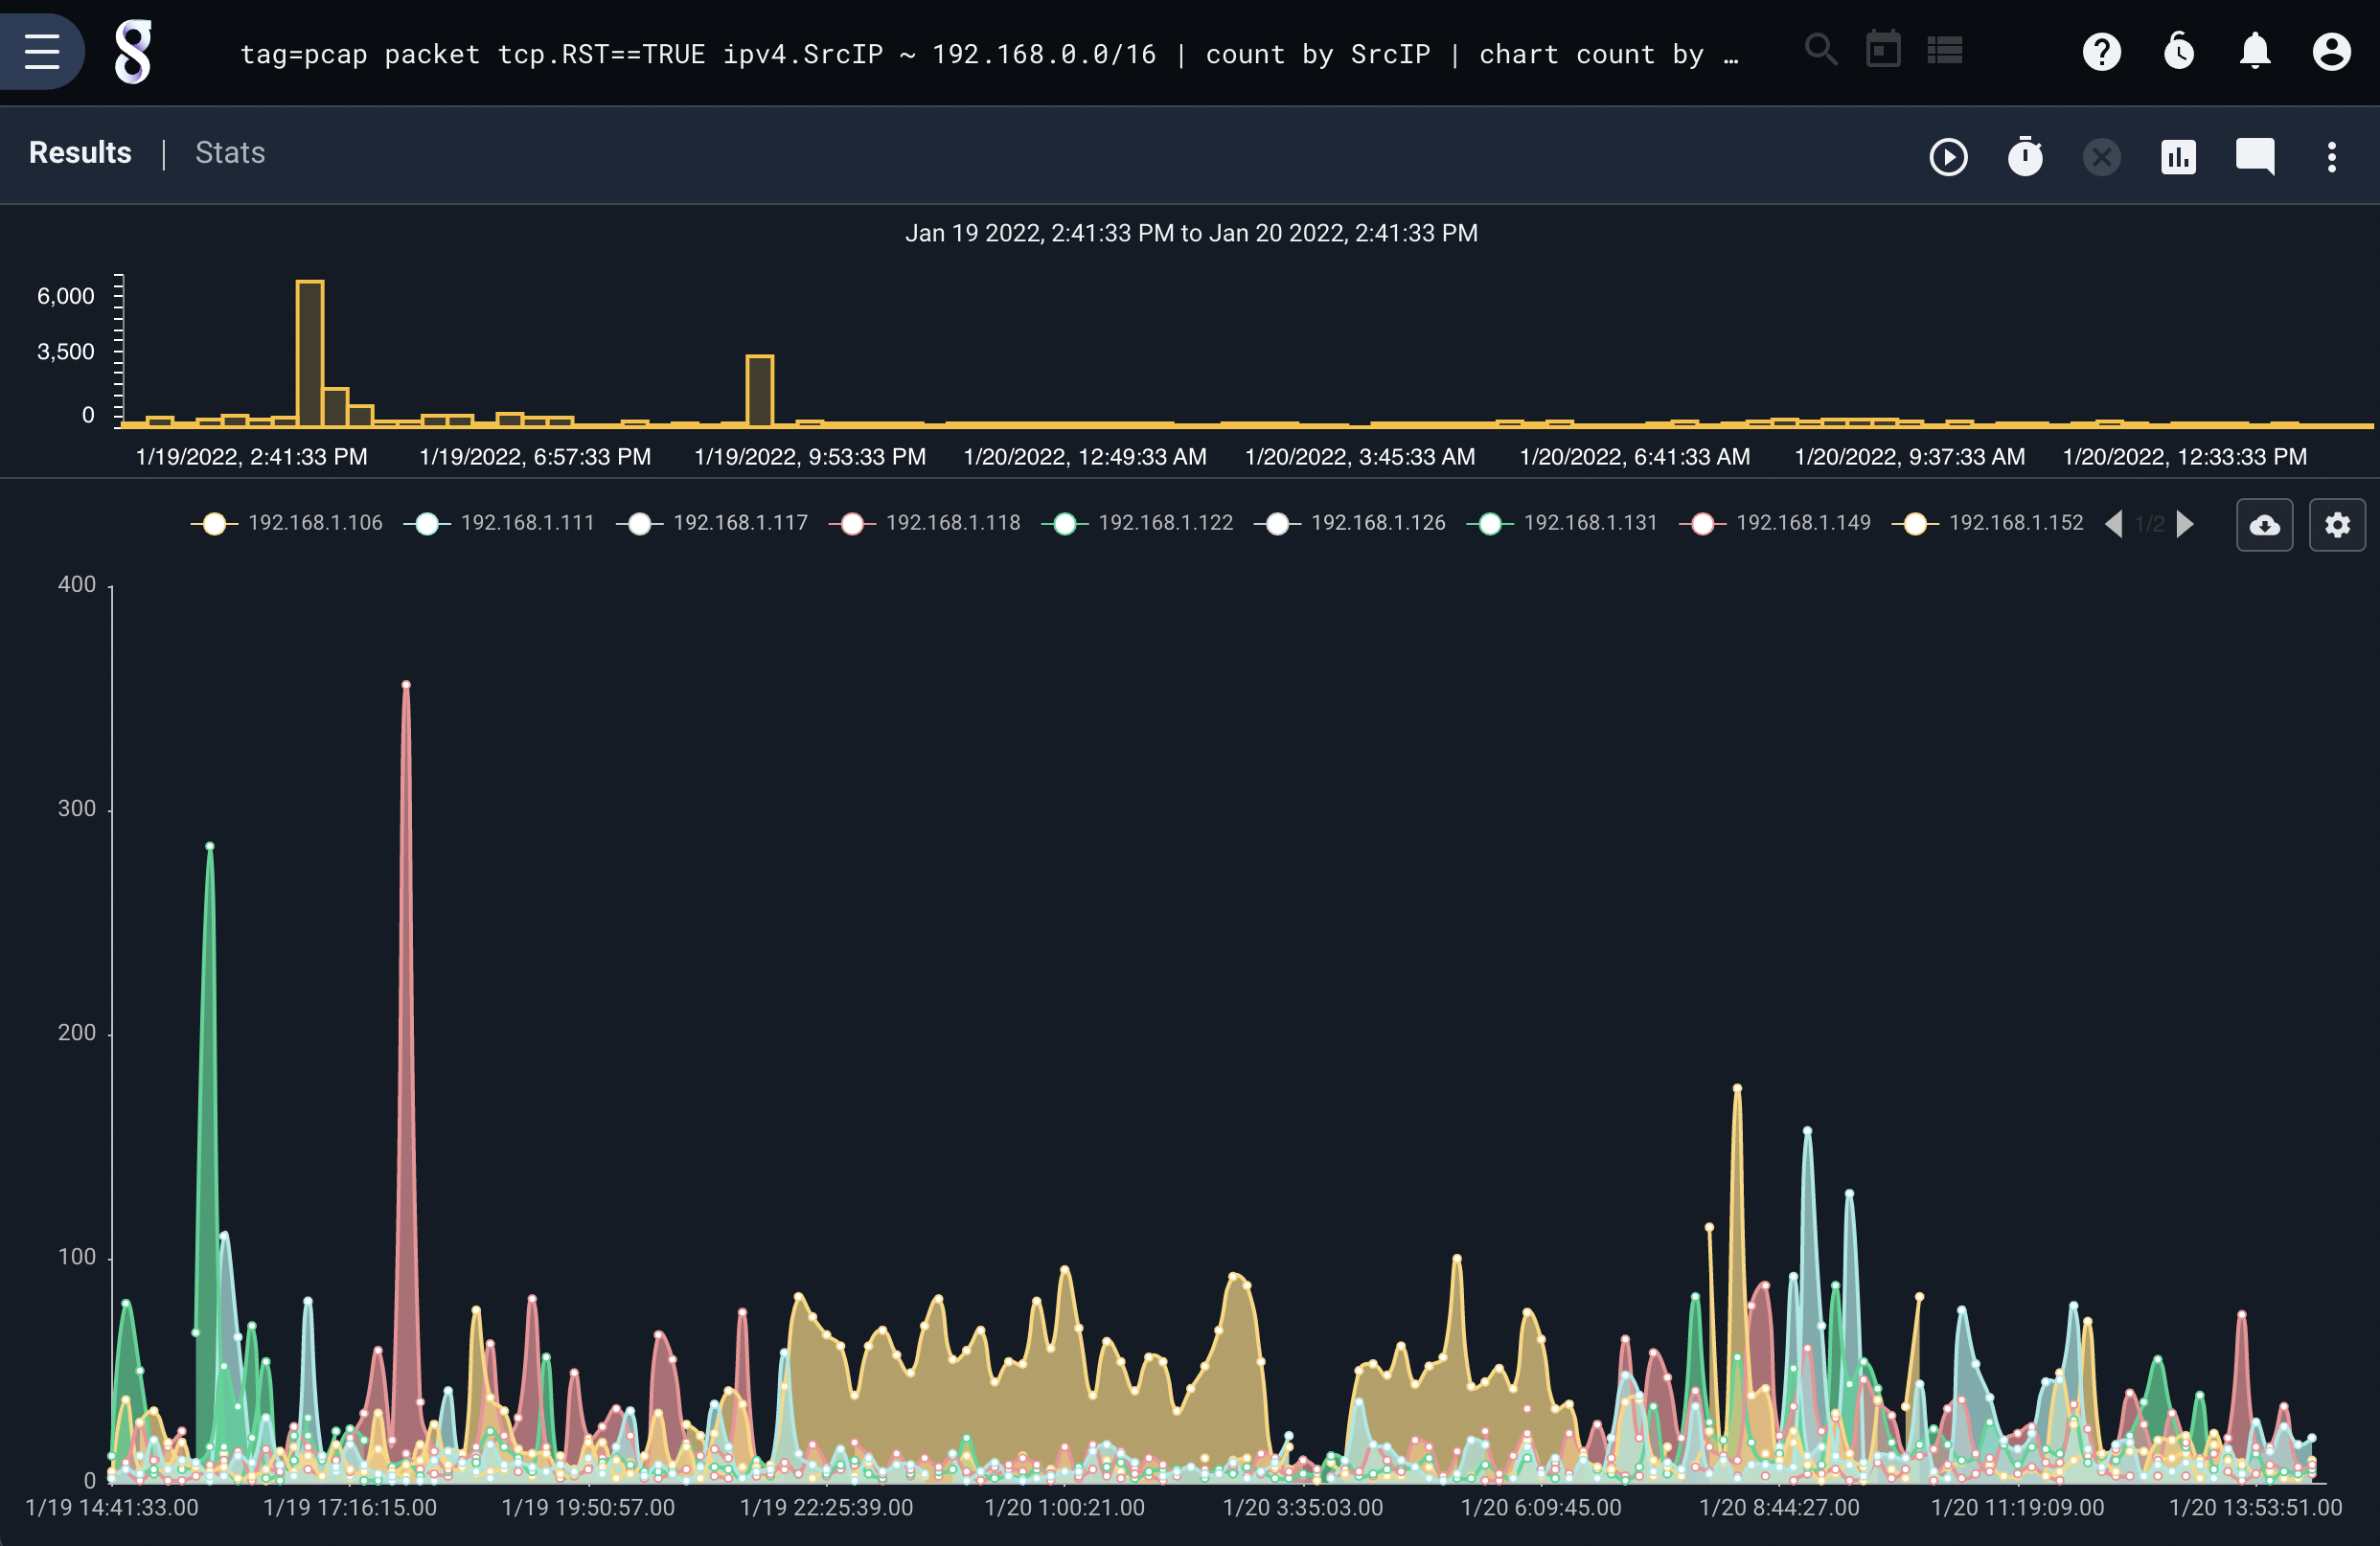
The following search looks for TCP packets with the RST flag set which do not originate from the IP 10.0.0.0/24 class C subnet and then graphs them by IP. This query can be used to rapidly identify outbound port scans from a network.
tag=pcap packet tcp.RST==TRUE ipv4.SrcIP ~ 192.168.0.0/16 | count by SrcIP | chart count by SrcIP limit 10
The following search looks for IPv6 traffic and extracts the FlowLabel, which is passed on to a math operation. This allows per-flow traffic accounting by summing the lengths of packets and passing them into the chart renderer.
tag=pcap packet ipv6.Length ipv6.FlowLabel | sum Length by FlowLabel | chart sum by FlowLabel limit 10
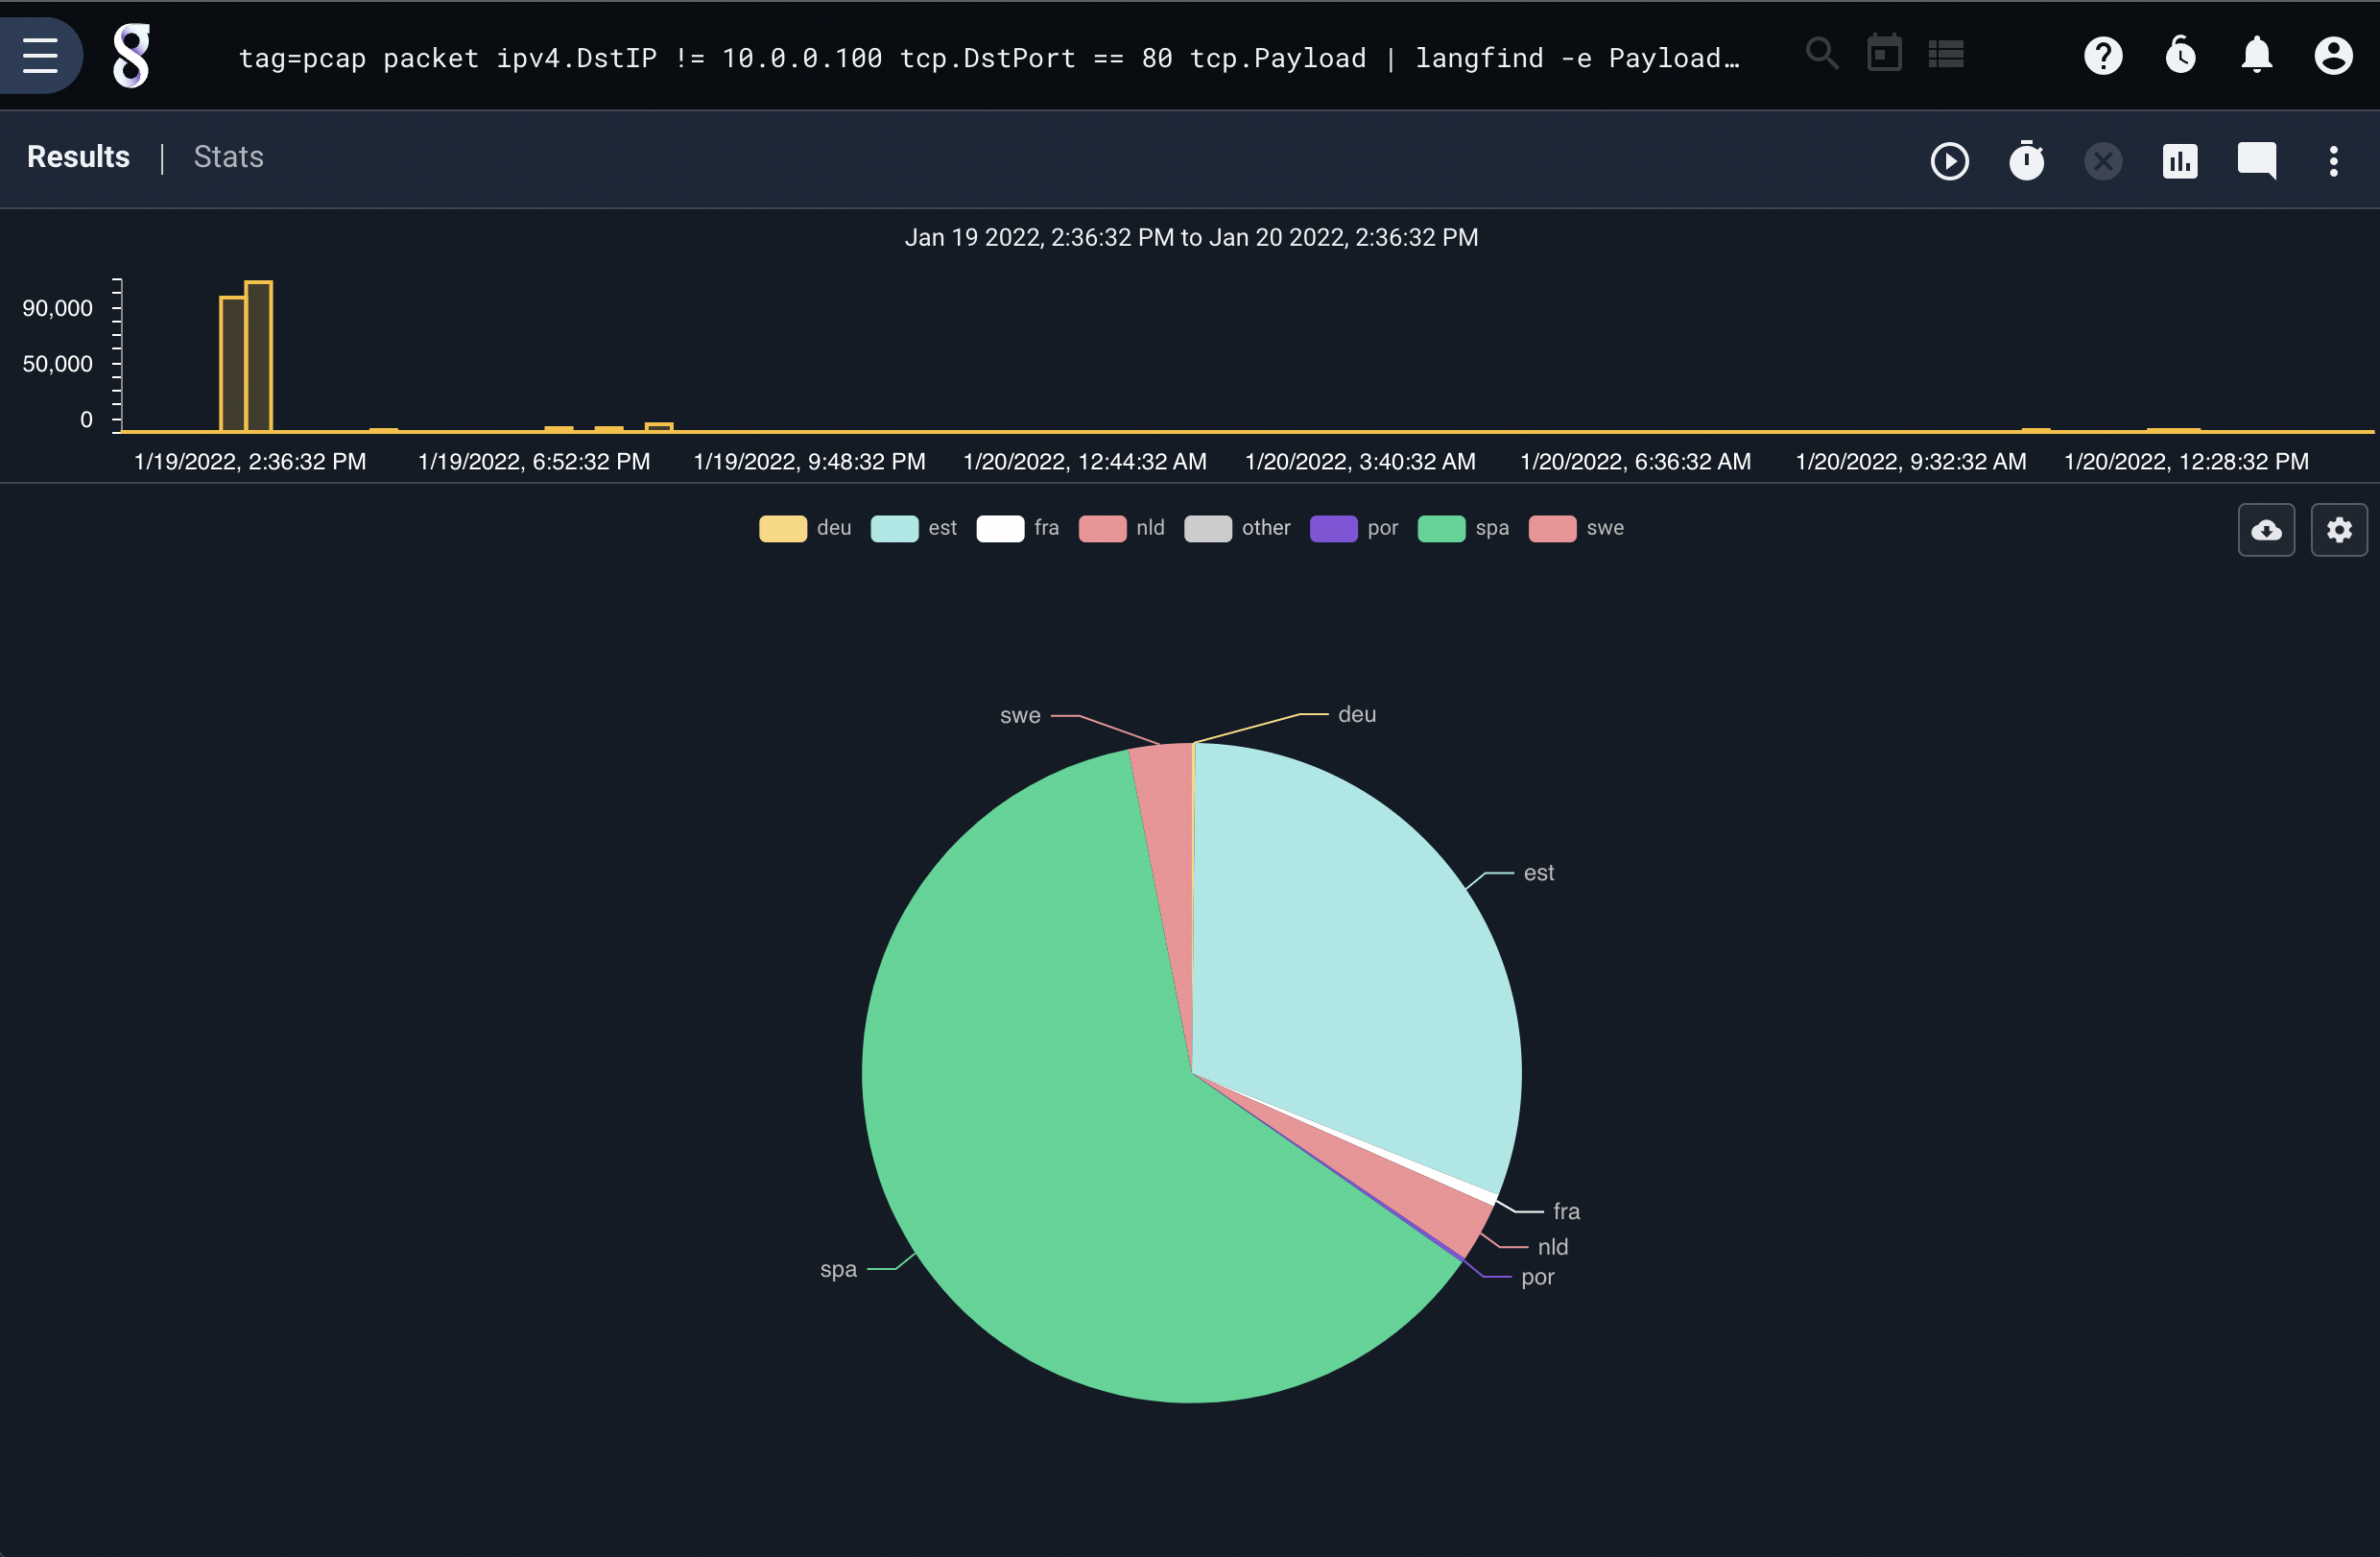
To identify the languages in use in TCP payloads, we can filter network data and pass it to the langfind module. This query is looking for outbound HTTP requests and handing the TCP payload data to the langfind module, which passes the identified languages to count and then chart. This produces a chart of human languages used in outbound HTTP queries.
tag=pcap packet ipv4.DstIP != 10.0.0.100 tcp.DstPort == 80 tcp.Payload | langfind -e Payload | count by lang | chart count by lang
Traffic accounting can also be performed at layer 2. This is accomplished by extracting the packet length from the Ethernet header and summing the length by the destination MAC address and sorting by traffic count. This allows us to rapidly identify physical devices on an Ethernet network that might be particularly chatty:
tag=pcap packet eth.DstMAC eth.Length > 0 | sum Length by DstMAC | sort by sum desc | table DstMAC sum
A similar query can identify chatty devices via packet counts. For example, a device may be aggressively broadcasting small Ethernet packets which stress a switch but do not amount to large amounts of traffic.
tag=pcap packet eth.DstMAC eth.Length > 0 | count by DstMAC | sort by count desc | table DstMAC count
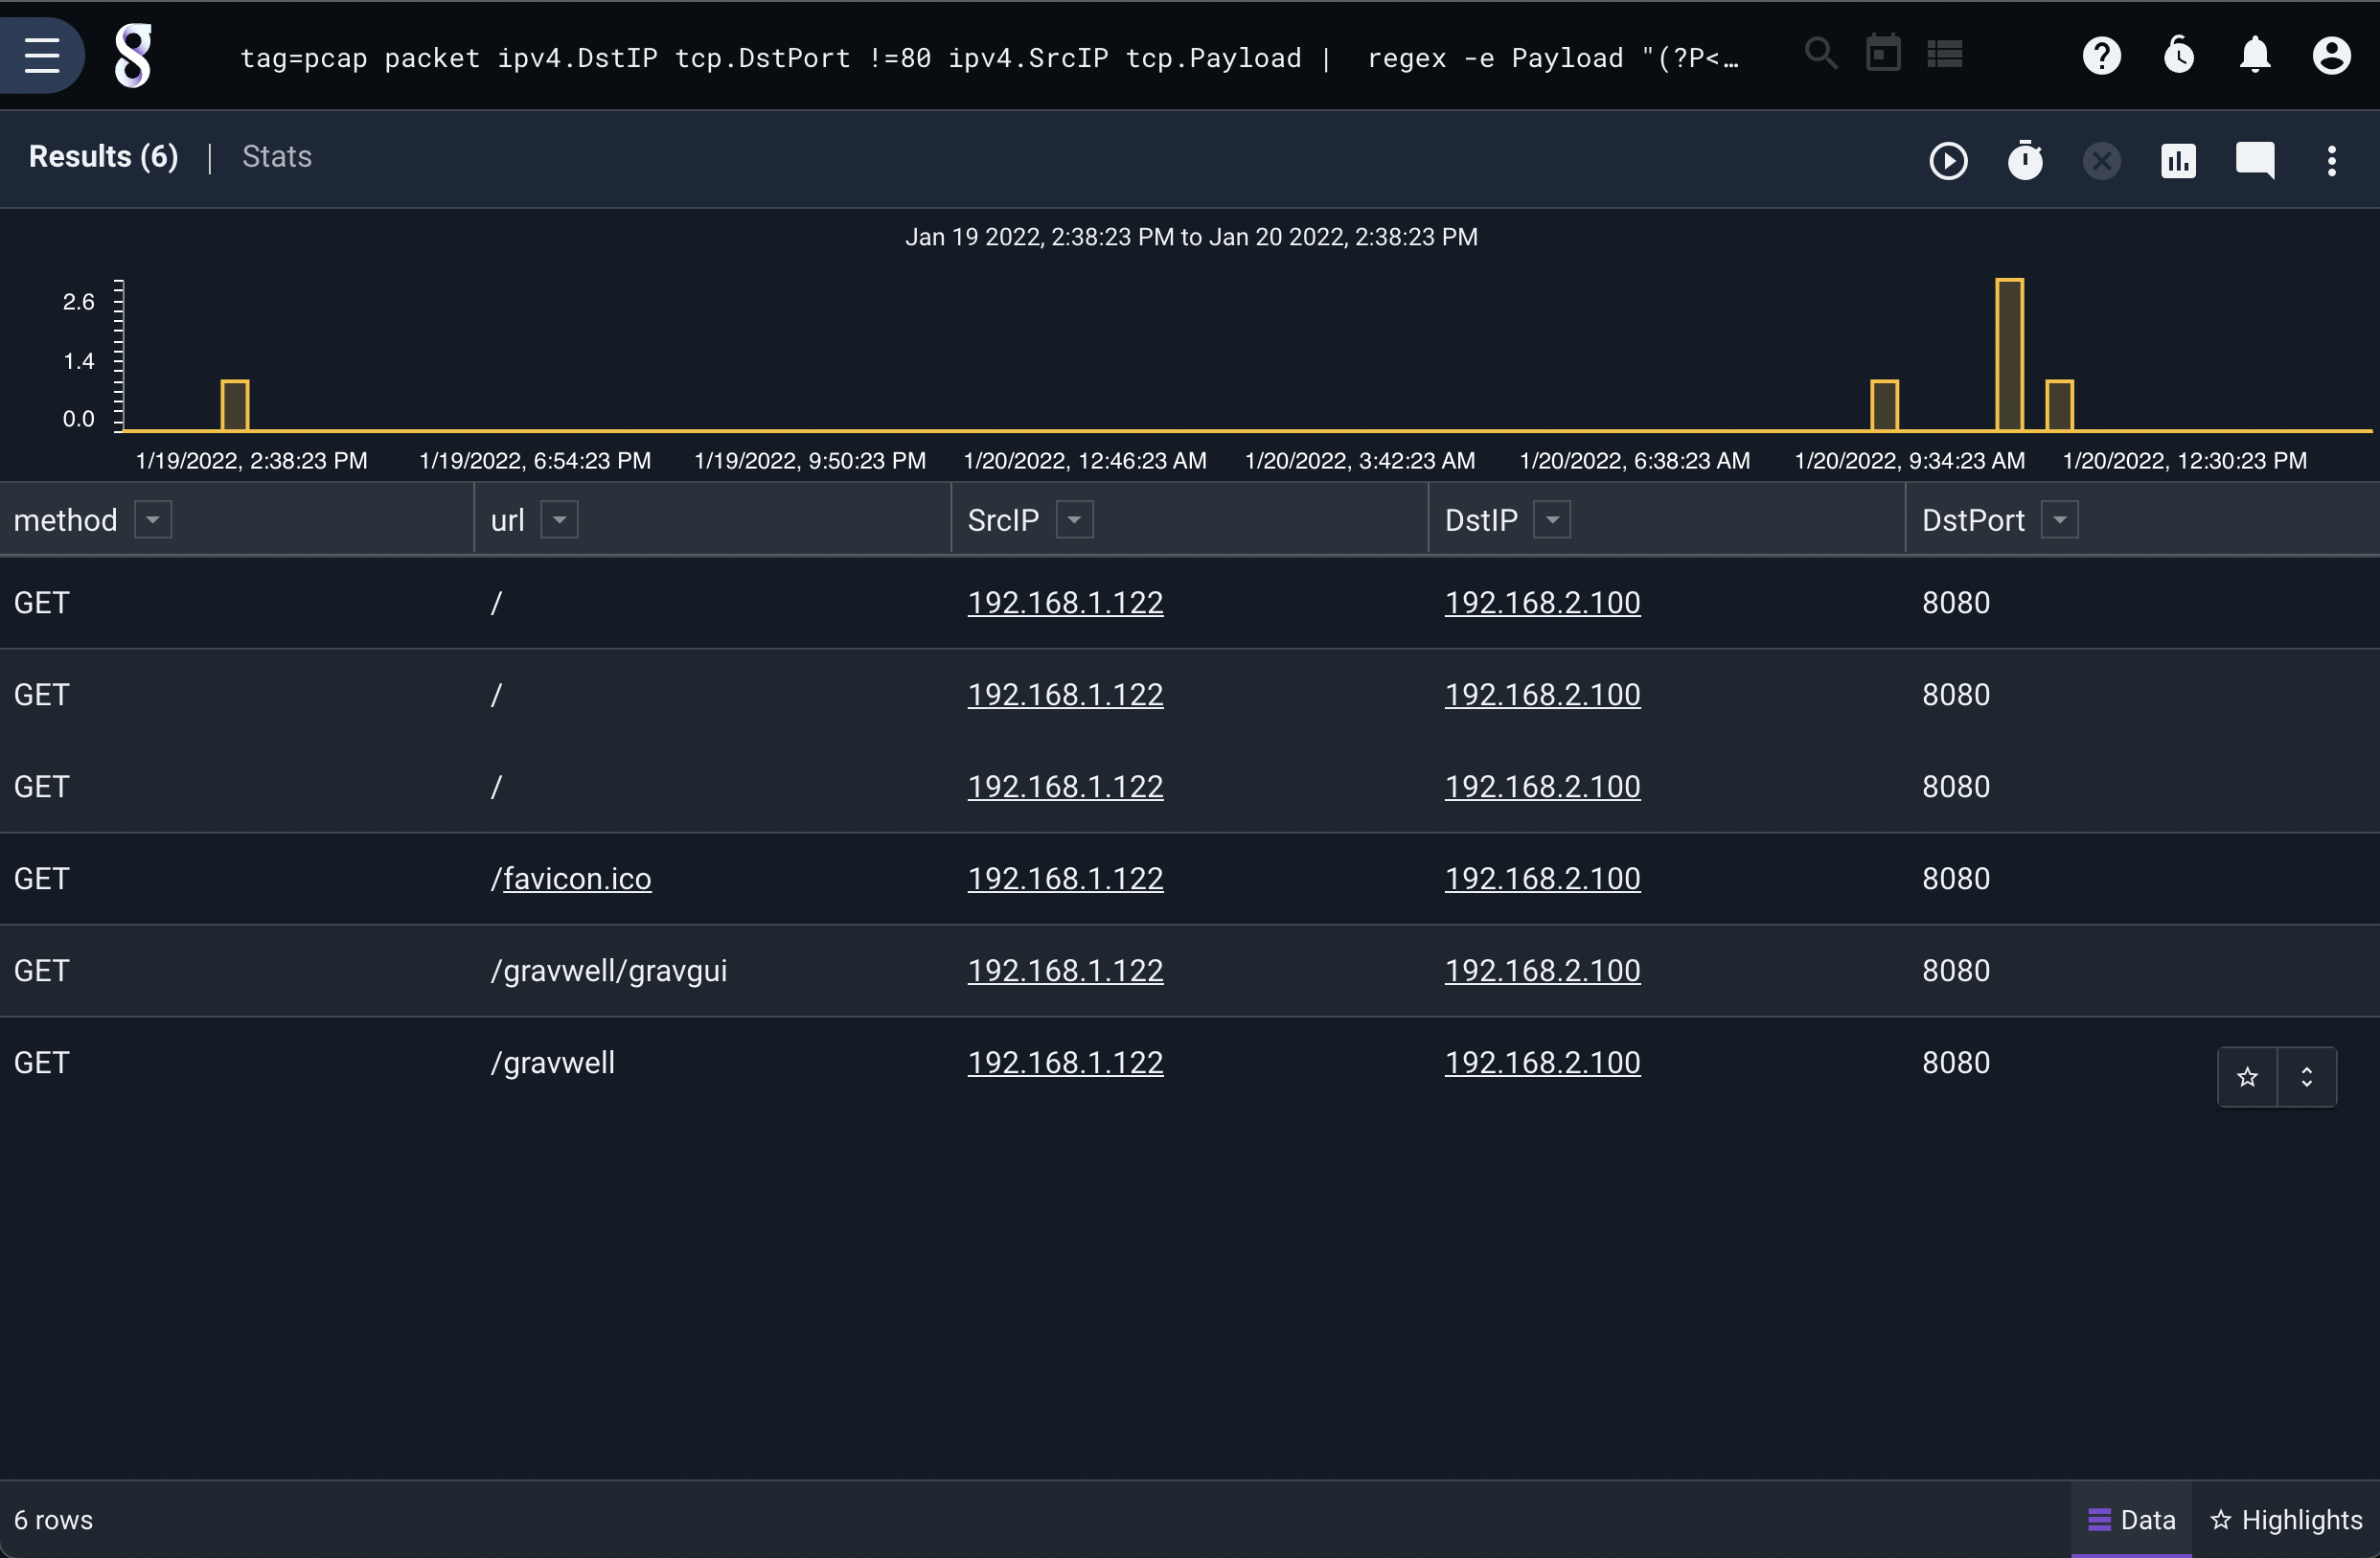
It may be desirable to identify HTTP traffic operating on non-standard HTTP ports. This can be achieved by exercising the filtering options and passing payloads to other modules. For example, looking for outbound traffic that is not TCP port 80 and is originating from a specific subnet and then looking for HTTP requests in the packet payload allows us to identify abnormal HTTP traffic:
tag=pcap packet ipv4.DstIP tcp.DstPort !=80 ipv4.SrcIP tcp.Payload | regex -e Payload "(?P<method>[A-Z]+)\s+(?P<url>[^\s]+)\s+HTTP/\d.\d" | table method url SrcIP DstIP DstPort